MethaneScan®

Targeting the oil and gas industry’s methane emitters

Get in touch today

Request a demonstration and
receive subscription information

Tracking methane emissions of the largest publicly-listed oil and gas producers in North America

Methane is by far the most potent greenhouse gas. Stopping methane leaks represents the most impactful action we can take this decade to avert catastrophic climate change. Deploying live satellite data analytics, MethaneScan® detects elevated methane emissions at the wellhead level and attributes them in aggregate to asset owners.

Available Now: MethaneScan Oil & Gas Annual Report (Jan 2024)

Announcing a ground-breaking 30-page report that provides an unparalleled analysis of methane emissions across the Top 50 North American Oil and Gas producers.

Produced by our partner GEO (Geofinancial Analytics), the report provides investors with critical insights into which companies are proactively managing their emissions and which are at risk of incurring substantial fines. It includes:

  • Executive summary
  • Satellite-observed emissions (scores, rankings, emissions trends)
  • Reporting gap analysis (self reported vs. satellite-observed)
  • US EPA methane fee estimates for excessive emissions
  • Methodology, technical documentation and frequently asked questions

This comprehensive report, available for $8,500, features insightful data visualizations and includes complete data files for bespoke analysis.

Purchase the report before April 5 and get a 20% discount – $6,800 (use code: FFI0324).

MethaneScan Report 2024

Beyond Carbon

Oil and gas operations are the largest source of methane emissions from the energy sector. FFI Solutions has partnered with GEO (Geofinancial Analytics) to provide institutional investors and their asset managers a new tool for assessing and comparing methane emissions of North American oil and gas companies.

MethaneScan delivers company-level Methane Leak Ratings that reveal elevated levels of risk including liability for erroneous disclosures and greenwashing. The ratings enable institutional investors, asset managers, fund managers, and consultants to better manage risk, inform portfolio and index construction, and align with climate targets.

Research & Monitor

Integrate MethaneScan indicators into decarbonization, net zero, and ESG scoring frameworks on fossil fuels.

Engage & Advocate

Engage companies on better management and disclosure of methane emissions in their operations.

Screen & Divest

Enhance standard Carbon Underground 200 screens with MethaneScan emission intensity scores.

FFI-Solutions-MethaneScan

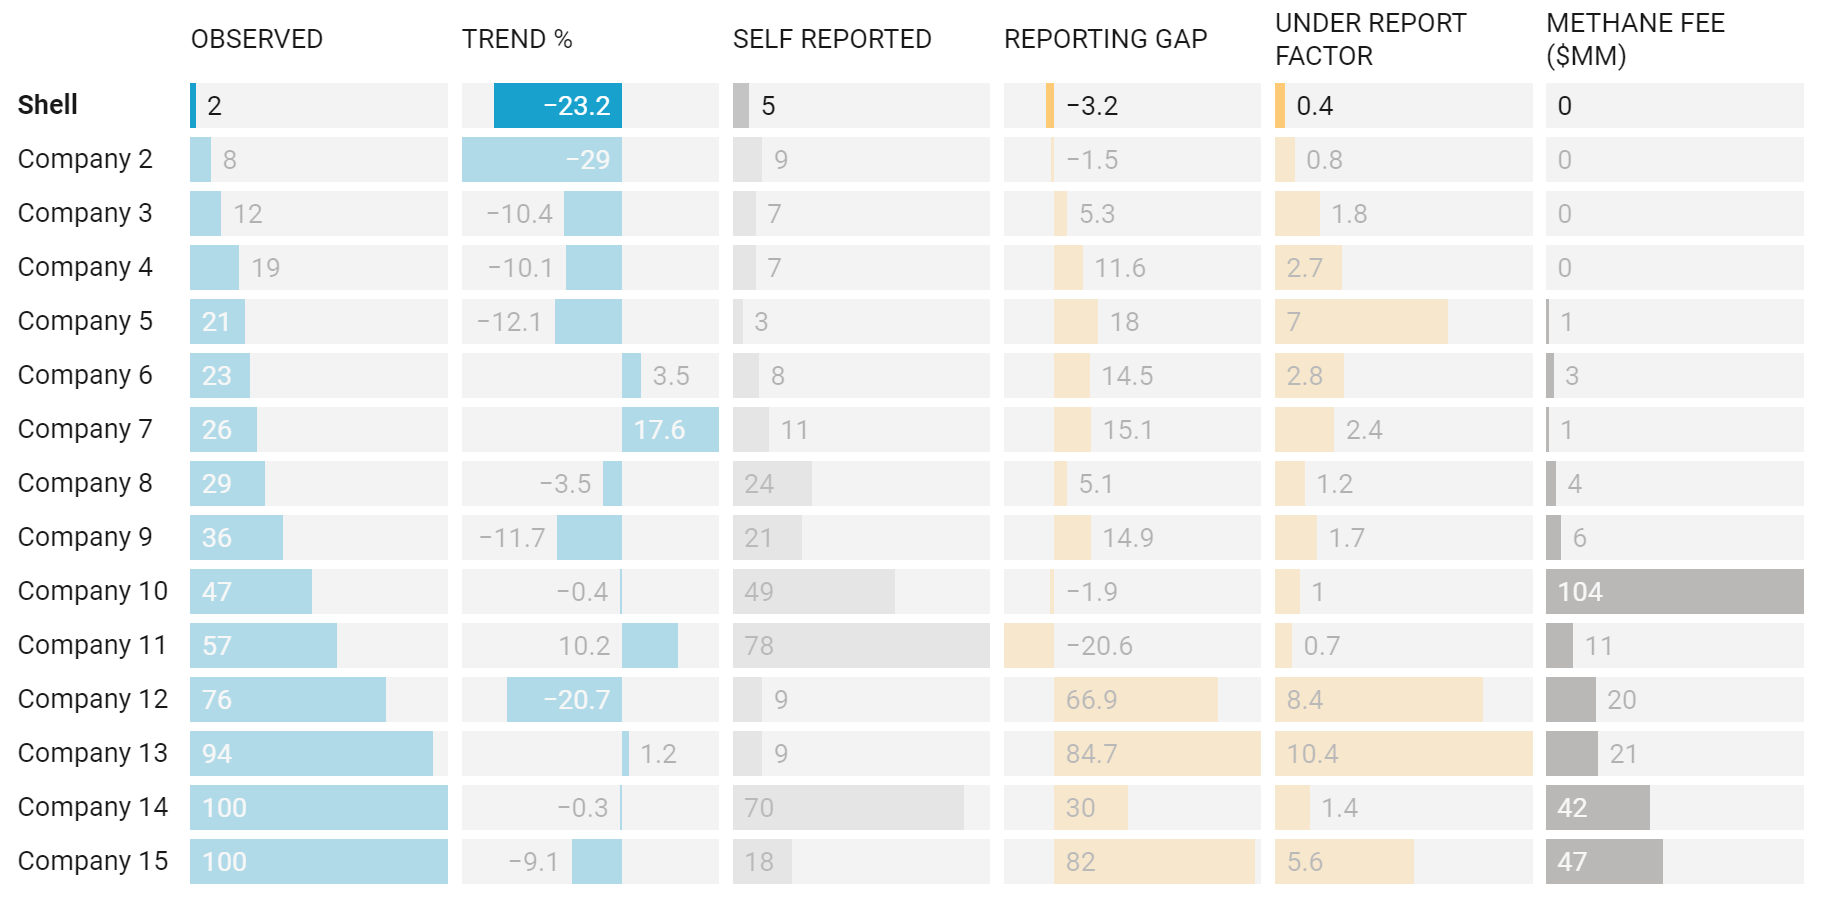
Leaders and Laggards Indicators

MethaneScan® rates the top energy producers on the single most material environmental performance metric – methane emission intensity. The service delivers direct satellite observations versus company-reported methane intensity for the top 50 North American oil and gas producers. MethaneScan tracks sustainability leadership on the key performance indicators (KPIs) of methane management and transparency.

2023 MethaneScan® Scorecard - Top North American Oil & Gas Producers

FFI Solutions - GEO - Methanescan Scorecard

Last 12 months as of September 30, 2023. Sorted by Observed (0=best).

Coverage

  • Data from onshore wellheads for North America
  • Top 50 upstream E&P companies in North America

Indicators

  • Satellite-observed emissions (scores, rankings, emissions trends)
  • Reporting gap analysis (self reported vs. satellite)
  • US EPA methane fee estimates for excessive emission

Updates

  • Annual constituent updates
  • Quarterly reference data and corporate action updates
  • History starting in 2018

Delivery

  • Operational flat files or Excel
  • Optional Carbon Underground files integration
  • FTP / SFTP / Email

Advanced Analytics and Engagement Advisory

Need more in-depth data? Looking for customized methane engagement and screening tools?

MethaneScan®The Carbon Underground 200TM
Top 5 U.S. Oil & Gas Reserves Embedded Emissions
CompanyEmission
Intensity Rating
1 Year
Trend
Ranking
Q1 2023
Total
Gt CO2
%
Gas
%
Oil
ExxonMobilBBB+5.7%75.9634.4%65.6%
ChevronA+5.9%113.9742.4%57.6%
ConocoPhillipsCC+6.1%152.3733.4%66.6%
EOG ResourcesCCC+2.4%211.5330.6%69.4%
EQTD- 0.6%241.3595.9%4.1%

Learn about enhanced methane data and energy transition analysis including:

Additional Resources

MethaneScan® is delivered in partnership with GEO (Geofinancial Analytics).

GEO is a science-driven data provider whose civic mission is to accelerate the clean energy transition by informing decisions and business practices with transparent, objective facts using advanced geospatial technology.